lambda
Atmospheric River Event Simulated with WRF
Introduction
An Atmospheric River(AR) is a narrow corridor or filament of concentrated moisture in the atmosphere. The concept states that five or six major ARs are present in each hemisphere most of the time, with moisture fluxes comparable to the runoff of the Mississippi River(Newell et al. 1992; Zhu and Newell 1998). They are often associated with the meridional transport of water and energy, providing precipitation for the mid-latitude but on the other hand threating its hydraulic infrastructures with devastating floods and debris flows.
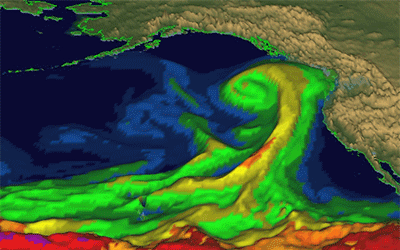
Total Column Water Vapor Kinematics. GIF provided by NOAA’s Earth System Research Laboratory.
By indicating the comparability between the elusive atmospheric dynamic pattern to the common “river”, the AR name hit a big success in marketing meteorology to the public. However, popularity comes with misunderstandings. The name “river” leaves the impression of long travelling moisture contributing to the heavy precipitation, which is proved to be misleading through idealized case study and Lagrangian analysis.
the precipitation resulting from AR remains 62 poorly forecast (Lavers et al. 2016; Wick et al. 2013; Junker et al. 2009).
Below we apply a dynamical downscaling model, Advanced Research Weather Research Forecast(WRF-ARW) model, to study the circulation dynamics and its associated precipitation distribution of a typical AR event in the West Coast United States. The purpose of this practice is to illustrate the extratropical cyclone theory and prepare myself for the upcoming work of assimilating remote sensing precipitation data for better winter storm dynamical simulation and forecast.
Related Works
ARs in the West Coast United States have been intensively observed and investigated given its significant positive/negative influences, especially under the recent 2011-2016 California Drought scenario.
The horizontal structure of AR can be retreivaled from passive microwave remote sensing radiations, which is available from many microwave sensors, including AMSR-E, AMSR2, GMI, SSM/I, SSMIS, TMI, and WindSat. Imageries of AR can be found here. They really look similar to the famous Japanese drawing The Great Wave off Kanagawa.
This horizontal structure is generally well explained in the context of its placement within the warm conveyor belt of synoptic-scale cyclones (Bao et al. 2006). The vertical structures, which explain the spatial precipitation distribution under orographic enhancement, are revealed through a series of aricraft-based field campaigns, during which dropsondes were released to record weather data as they descend. The campaigns include:
1, the California Land-Falling Jets Experiment (CALJET) in 1998
2, the Pacific Land-Falling Jets Experiment (PACJET) in 2001
3, the CalWater intensive observing Experiments in 2015
Besides the aircraft-based observations, the NOAA Hydrometeorological Testbed has operated gauge-based “Atmospheric River Observatory” (ARO) at two sites, Bodega Bay and Cazadero, CA, since 2006 (White et al. 2009, 2013). The Bodega Bay (BBY) site is situated on the coast at sea level and is designed to monitor horizontal vapor flux, integrated water vapor and horizontal winds in the Atmospheric River low-level jet region as they impinge upon the orographically productive coastal mountain ranges. The Cazadero Site is located north of Bodega Bay at the top of a prominent ridge in the coastal mountain system. Cazadero drains to the South and Wheatfield forks of the Gualala River. The Cazadero site reports precipitation, vertical S-Band radar reflectivity and precipitation drop size distributions during AR conditions at mountaintop.
The observatories offered great opportunity to varify and diagnose current dynamical simulation models. A framework that accomodates WRF for the region, named West-WRF, was implemented and tested by the Scripps Institution. Skills in predicting tropospheric state during AR, AR core structure, and AR precipitation at varying spatial scales and for a comprehensive set of forecast lead times up to seven days were evaluated. Daniel Swain etc. conducted 3 month continuous WRF nonhydrostatic simulations to address an existing gap in knowledge regarding the ability of atmospheric models to simulate the finescale vertical and horizontal structure of atmospheric rivers.
- Overestimate rainfall on windward slope but underestimated on the lee slope(Colle and Mass 2000)
- Positive moisture bias upstream(Hahn and Mass 2009, Ma et al. 2011)
- Overpredicting orographic precipitation(Garvert et al., 2005)
- Wet bias in both short and long term forecast(Chin et al. 2010)
Case Description
The Russian River Basin is a characteristic watershed of the California coast ranges. The river springs from the Laughlin Range and flows southward to Redwood Valley,
The two simulations are targeted at the dates of the CALJET and PACJET field campaigns [January–March (JFM) 1998 and JFM 2001; initialized on 1 January 1998 and 1 January 2001, respectively]. Since the earliest calendar date occurrence of any AR included in this study (in either 1998 or 2001) is 21 January,
Data
General Circulation Model Forcings
AR Observatory
Observaitions of different sources were used for model performance evaluation, including:
-
NOAA Hydrometeorological Testbed –West Surface Nework + 2m air temperature + relative humidity + 10m horizontal wind + precipitation
-
Upper air soundings from National Weather Service rawinsonde network
Radio Occultation very important. Ma, et al 2011
In the case of the neutral atmosphere (below the ionosphere) information on the atmosphere’s temperature, pressure and water vapour content can be derived giving radio occultation data applications in meteorology.
Model Configuration
WRF Preprocessing System
In the Preprocessing part, we should provide the software with:
- Static geographic data
- Dynamic initial and boundary meteorological data
Several constrains regarding the spatial temporal coverage, resolution, domain nesting and input/output format should be pre declared in a script named namelist.wps. Details of howto can be found here.
With all the input data and case description script prepared, we can run the WPS program. It is consisted of three parts, the geogrid.exe fits the original static geographic data to the resolution defined in namelist file, the ungrib.exe resolves the dynamic meteorological data, the metgrid.exe merges the two. All the three sub programs obtain their parameters from the namelist.wps script.
WRF Dynamic Core Code
In the core code part, several constrains should be declared, including time control, domain control, physical parameterization scheme control, dynamics control, boundary control and some others. Below we explain some key ideas behind these controls and evaluate their influences by reviewing existed experiments in the literature.
Time Control
Parameters regarding time control were listed as follows:
&time_control
 run_days                            = 11,
 run_hours                           = 0,
 run_minutes                         = 0,
 run_seconds                         = 0,
 start_year                          = 2010, 2010,
 start_month                         = 02,   02,
 start_day                           = 10,   10,
 start_hour                          = 00,   00,
 start_minute                        = 00,   00,
 start_second                        = 00,   00,
 end_year                            = 2010, 2010,
 end_month                           = 02,   02,
 end_day                             = 20,   20,
 end_hour                            = 00,   00,
 end_minute                          = 00,   00,
 end_second                          = 00,   00,
 interval_seconds                    = 21600
 input_from_file                     = .true.,.true.,
 history_interval                    = 180,  60,
 frames_per_outfile                  = 1, 1,
 restart                             = .false.,
 restart_interval                    = 5000,
 io_form_history                     = 2
 io_form_restart                     = 2
 io_form_input                       = 2
 io_form_boundary                    = 2
 debug_level                         = 0
/
Many of the parameters are self-explainable, such as “run_days”, “start_year”, etc.. For instance, the simulation here starts from 00:00 UTC Jan 10, 2010 to 00:00 UTC Jan 20, 2010. Total run time is 11 days, start and end date for the 2 nested domains are also determined.
“Interval_seconds” denotes the frequency of incoming meteorological boundary constrains. For instance, in my case, the met_em*.nc data come every 6 hours, so it is 6*3600=21600 seconds.
“Input_from_file” indicates whether the domain will have input boundary constrains. Of course the 1st domain must have input data, which have been generated in the WPS process and linked here, usually named “met_em.d01.year_month_day_hour_min.nc”. We talk about the pros and cons for the input of the nested domain
- No input needed for nested domains.
All static and meteorological data are interpolated from the coarse grid to the nested grids.
- Advantage: Nested domains may start at different times.
- Disadvantage: Nested domains do not benefit from high resolution static fields.
- Both domains must have a wrfinput_d0x file at the start of the model run.
All static and meteorological data for the nest(s) are obtained from the nest’s input file.
- Advantage: Nested domains benefit from high resolution static fields.
- Disadvantage: Nested domains must start at same time as the coarse grid domain.
Here the two domains start at same time, we set “input_from_file” to true to enjoy the high resolution of the nested field.
“History_ interval” denotes the frequency(in minutes) to wrte result to wrfoutput file.
“frames_per_outfile” indicates how many time periods’ output is written to the wrfoutput file. For instance, 1 indicates each wrfoutput* have one period’s result(here is 180 minutes, 3 hours).
Domain Control
Parameters regarding spatial control were listed as follows.
&domains
 time_step                           = 180,
 time_step_fract_num                 = 0,
 time_step_fract_den                 = 1,
 max_dom                             = 2,
 e_we                                = 133,   163,
 e_sn                                = 133,   202,
 e_vert                              = 30,    30,
 p_top_requested                     = 5000,
 num_metgrid_levels                  = 27,
 num_metgrid_soil_levels             = 4,
 dx                                  = 30000, 10000,
 dy                                  = 30000, 10000,
 grid_id                             = 1,     2,
 parent_id                           = 1,     1,
 i_parent_start                      = 1,     40,
 j_parent_start                      = 1,     35,
 parent_grid_ratio                   = 1,     3,
 parent_time_step_ratio              = 1,     3,
 feedback                            = 1,
 smooth_option                       = 0
/
“Time_step”, “ time_step_fract_num” and “ time_step_fract_den” are parameters indicating the integration time step for numerical solution of the Atmospheric Governing Equation. It is suggested to be 6*dx, where time step is measured in second and dx measured in km. The specific time step(dT) is calculated with the following equation:
“max_dom” is 2 since 2 domains were applied here.
For “e_we”, “e_sn”, the horizontal expansion must match the WPS dimensions.
“e_ver” denotes number of number of vertical layers on which real.exe will interpolate incoming meteorological data.
Physical Parameterization Control
&physics
 mp_physics                          = 2,     2,
 ra_lw_physics                       = 1,     1,
 ra_sw_physics                       = 1,     1,
 radt                                = 30,    30,
 sf_sfclay_physics                   = 1,     1,
 sf_surface_physics                  = 2,     2,
 bl_pbl_physics                      = 1,     1,
 bldt                                = 5,     5,
 cu_physics                          = 1,     1,
 cudt                                = 5,     5,
 isfflx                              = 1,
 ifsnow                              = 1,
 icloud                              = 1,
 surface_input_source                = 3,
 num_soil_layers                     = 4,
 num_land_cat                        = 21,
 sf_urban_physics                    = 0,     0,
 /
Dynamic Control
&dynamics
 w_damping                           = 0,
 diff_opt  	                      	 = 1,      1,
 km_opt                              = 4,      4,
 diff_6th_opt                        = 0,      0,
 diff_6th_factor                     = 0.12,   0.12,
 base_temp                           = 290.
 damp_opt                            = 0,
 zdamp                               = 5000.,  5000.,
 dampcoef                            = 0.2,    0.2,
 khdif                               = 0,      0,
 kvdif                               = 0,      0,
 non_hydrostatic                     = .true., .true.,
 moist_adv_opt                       = 1,      1,
 scalar_adv_opt                      = 1,      1,
 /
Boundary Control
 &bdy_control
 spec_bdy_width                      = 5,
 spec_zone                           = 1,
 relax_zone                          = 4,
 specified                           = .true., .false.,
 nested                              = .false., .true.,
 /
Cheatsheet for WRF
For sure the installation and simulation process of WRF is pretty cubersome since few attention is put on the client-software interface of this atmosphere simulation software.
During a terrible fever that stuck me last summer, I wrote a bash script that automate the installation process, providing all the libraries’ links and core code compilation. I was afraid to be kicked out of the lab at that time. The code was used to prepare me a fast re-installation at a new position somewhere else on the earth. Now I decide to share it here since I was not kicked out.
One can write his/her own script file to automate the processes, too. For me, I choose Mathematica to generate the csh script. A detailed tutorial
Skill Metrics
Right answer for the right reason.
It is not considered sufficient to better forecast precipitation while simultaneously displaying larger error in storm scale AR measures
The variation of forecast accuracy (skill) with lead time (ti) is estimated using the verification 279 matrix procedure.
Results
Discussion
Conclusion
That information should help water managers to predict what atmospheric rivers may bring. Reservoir engineers in northern California typically release precious water from their reservoirs in the winter, so as to have enough space behind the dam to cope with the threat of flooding. With better knowledge of when atmospheric rivers might arrive and how much water they might carry, says Ralph, engineers should be able to manage that winter release more effectively
It is not complicated, it’s just a lot of it. <div style="text-align: right"> – Richard P. Feynman </div>